Visualizing the NASA ICON mission in 3D
Ricardo Mendez, Thomas Immel, and Nate Miller
August 4th, 2016
The ICON Explorer mission will provide several data products for the atmosphere and ionosphere after its launch in 2017. The products, which are different at day and night, could be made available in widely used visualization tools (Google Earth, Worldwide Telescope, etc). This project will support the mission by investigating the capability of these tools for visualization of
- The observatory characteristics and FOVs
- Data acquisition
- Science modes
- Representation of the data products
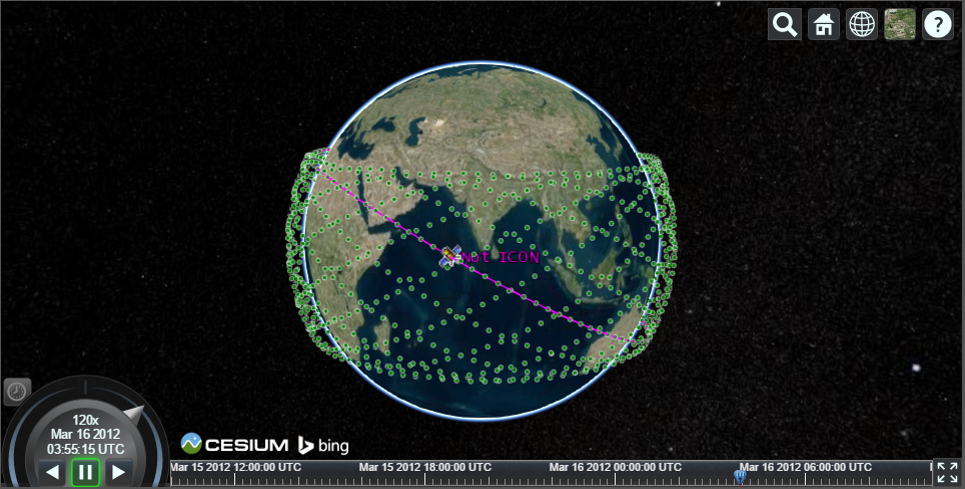
The ICON Explorer mission will provide several data products for the atmosphere and ionosphere after its launch in 2017. This project will support the mission by investigating the capability of these tools for visualization of current and predicted observatory characteristics and data acquisition. Visualization of this mission can be accomplished using tools such as Google Earth or CesiumJS, as well assistance Python. Ideally we will bring this visualization into the homes of people without the need of additional software. The path of launching a standalone website, building this environment, and a full toolkit will be outlined. Eventually, the initial work could lead to the addition of a downloadable visualization packages for science visualization or mission demonstration.
Previously Google Earth and a Keyhole Markup Language (KML) file was used for our models. This file allows Google Earth to load anything from map routes, weather patterns to satellite orbits. The problem with this approach is it requires the user to download additional software and files. The KML Application Programming Interface (API) has since been deprecated due to the foundation framework’s discontinued deployment for security reasons. CesiumJS is an open-source community driven project to display maps and 3d global data by Analytical Graphics, Inc. (AGI). The advantage of CesiumJS is it’s a JavaScript library and can be used virtually anywhere. Similar to Google Earth and a KML, a CZML is a JSON formatted file for describing dynamic and static scenes in CesiumJS. This approach allows the data to stay server sided and stream to the client. Python, a programming language, is utilized because of its ability to be used in various applications including data processing. Pyephem is a Python package allowing astronomical computations and includes a module for two-line element set (TLE) data extraction. TLE’s contains basic orbital information of an Earth-orbiting object for a given epoch. Scheduling is another Python package allowing jobs to be created; namely the use of automating the calculations needed for CZML writing. AGI has a CZML-writer written in Python, though has ease-of-use, is limited for utilization.
There are a couple of options when making a website available to the public. It can be hosted either by the employing organization, institution, or by an individual. For an individual to obtain a domain name, they need to register it with an Internet Corporation for Assigned Names and Numbers (ICANN) through a domain name registrar such as Google Domains or GoDaddy. Hypertext Markup Language (HTML) is the building blocks for the majority of websites on the internet. HTML is literally text with hyperlinks, which have properties known as Styles to design how the content is displayed. Cascading Style Sheets (CSS) is used to centralize the styling information of the HTML so the site developer does not have to restyle each element on the page individually. A loaded page with only text and links instead of panes and designs, usually indicates a problem loading the CSS file. jQuery, a JavaScript library, is used to make the interface of the website more appealing and allow manipulability. After the foundation of the website is built, we incorporate visuals like the Cesium environment using JavaScript and HTML.
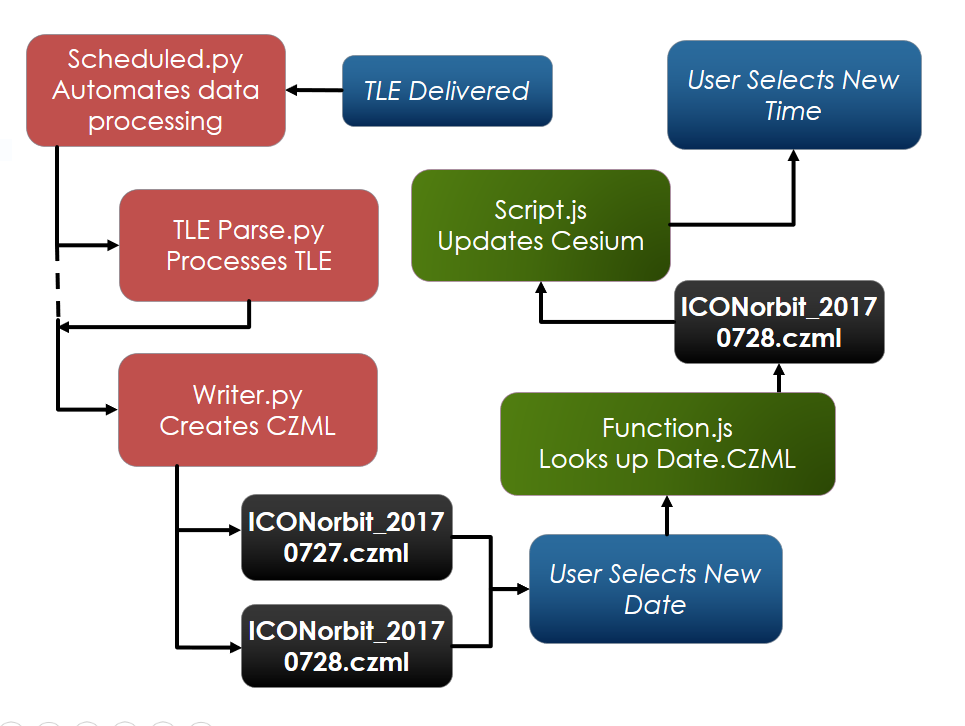
Architecture of Webpage Delivery
Visualizing the ICON mission’s orbit can be achieved in a myriad of ways from AutoCAD, Google Earth, JavaScript, and more. There are 3d model viewers by which we may incorporate in the future to view satellite and instrument models. These viewers support limited files and very few of our available file types can be converted into them. We’re looking into other options to accomplish this and make ICON and other missions’ data and designs available to the public in a convenient and user-friendly way. Data download would possibly require SQL for storage, sorting, and calling of the data a client needs. Building websites and applications are unmatchable ways to bring science into the homes of the general public as well transfer data for research in a quick and easy manner. Python offers the ability automate nearly all aspects of the model and essentially make the website self-managed. Later work may include merging images captured by ICON into the corresponding locations in the CesiumJS atmosphere.
- AnalyticalGraphicsInc/czml-writer. (2013, April 03). Retrieved August 01, 2016, from https://github.com/AnalyticalGraphicsInc/czml-writer
- KML Documentation Introduction. (2016, February 09). Retrieved August 02, 2016, from https://developers.google.com/kml/documentation/
- Heng, C. (n.d.). How to Register Your Own Domain Name. Retrieved August 04, 2016, from http://www.thesitewizard.com/archive/registerdomain.shtml
- Cesium - WebGL Virtual Globe and Map Engine. (n.d.). Retrieved July 26, 2016, from https://cesiumjs.org/